Representation of All-FIT’s results for detected variants. Loh et al. 2019.
The complexity in cellular populations that exist within a tumor
specimen is routinely summarized by the single qualitative measure
of tumor purity. All-FIT (Allele-Frequency-based Imputation of Tumor
Purity) is a method to estimate specimen purity based on the allele frequencies of variants
detected in high-depth sequencing data when
matched-normal control data is not available.
All-FIT computes cancer cell
fractions for a range of somatic and germline mutational
models and through an iterative process, estimates purity and
its statistical confidence intervals.
Error depth distribution in a
TP53 locus at 100,000x for transitions (left) and transversions
(right), with estimates from a
beta-binomial model, its aggregate
negative binomial (NB) approximation, and raw
data. Rabadan et al. 2018.
Backtrack is a statistical method to discern low-abundance
mutations from background error in ultra-deep sequencing data.
Backtrack utilizes a statistical multi-sample approach that goes beyond estimating fixed
detection thresholds allowed the discovery of variants with high
confidence after false discovery correction.
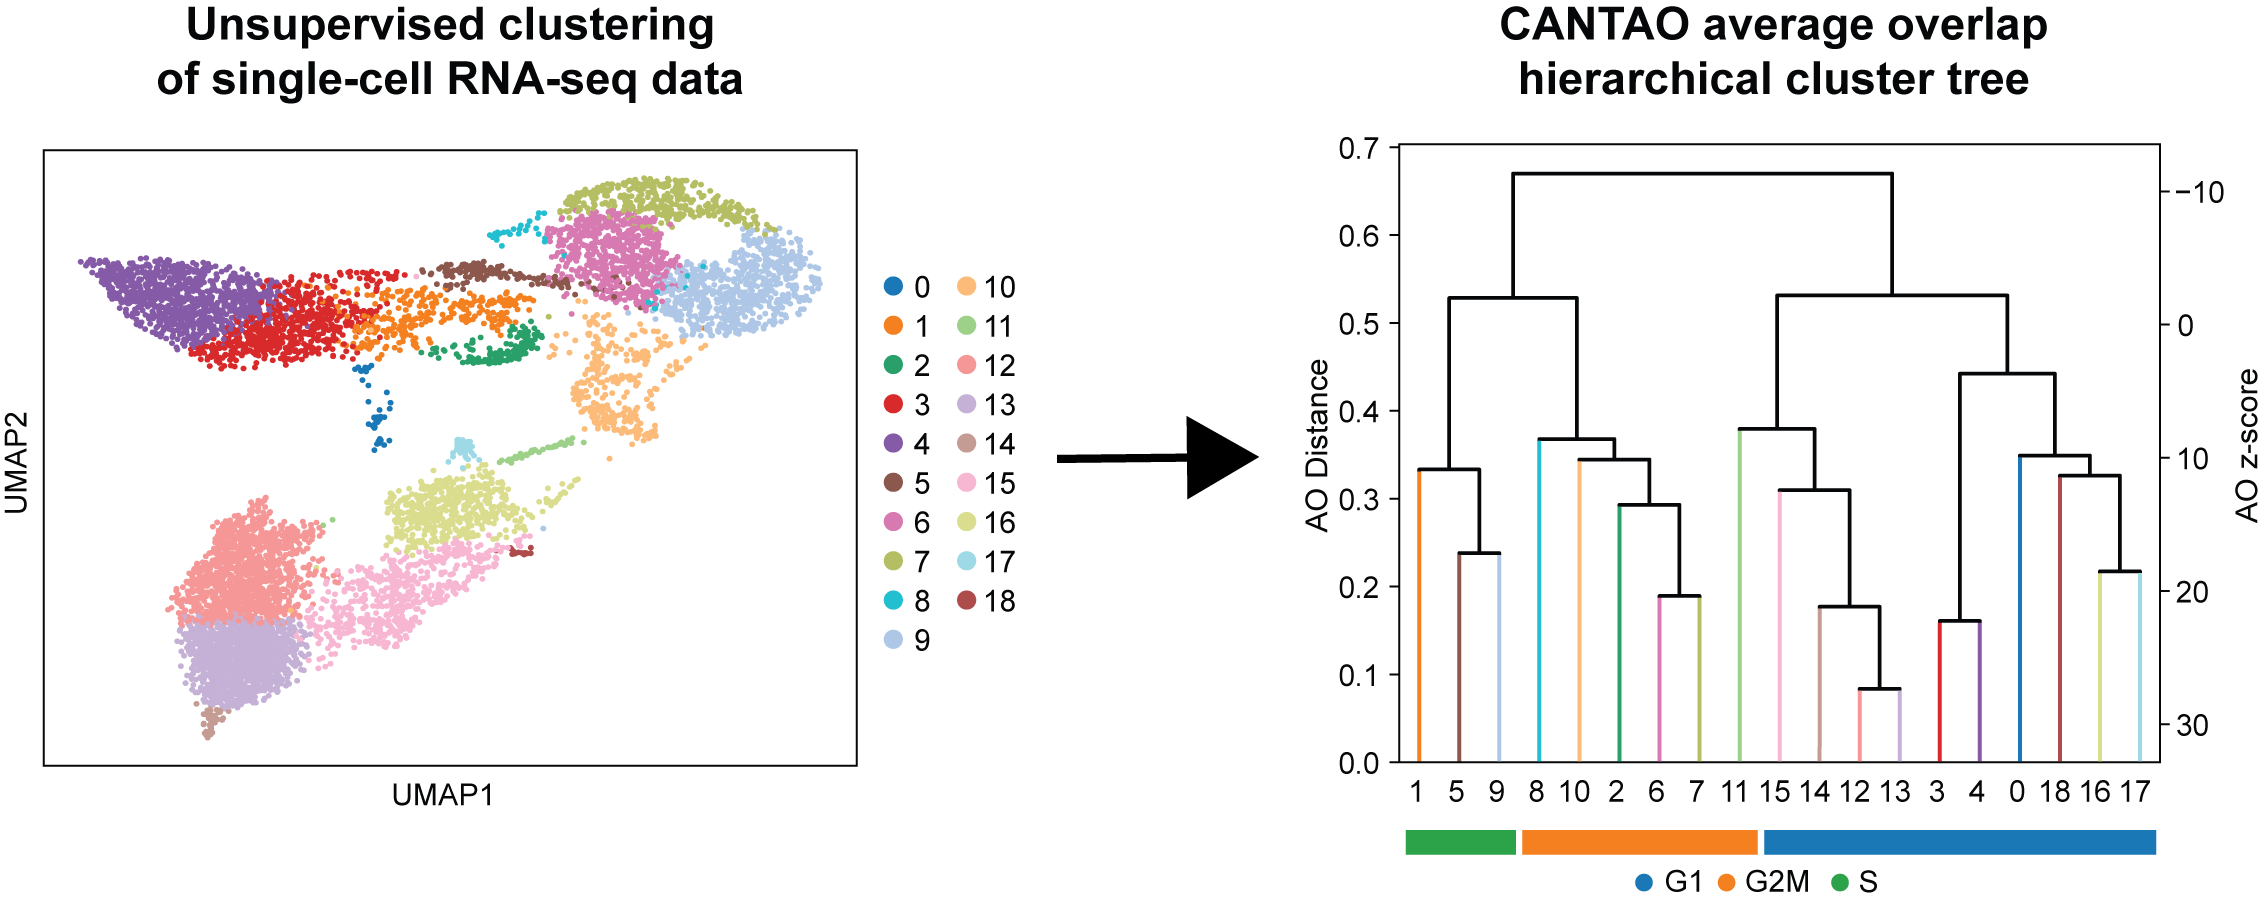
The CANTAO framework for analyzing single-cell RNA
sequencing data. Thai et al. 2026.
CANTAO is a method that uses the average overlap (AO) metric to quantify similarity of clusters inferred from unsupervised computational analyses of single-cell RNA sequencing data, based on the rankings of differentially expressed genes.
AO-guided clustering has been benchmarked using multiple truth-known datasets where CANTAO identifies cell populations that show the highest correspondence to true present cell identities.
The analysis of mouse thymocytes by CANTAO identified previously unresolved stages of T-cell development from RNA measurements of unsorted single cells, spanning bone marrow multipotent progenitors (MPPs), stages of double negative (DN) populations from DN1 to DN4, immature single positive (ISP) and double positive (DP) cells, and eventually mature CD4 and CD8 T-cells.
The platform's workflow for analyzing tumor-only
sequencing data. Jalloul et al. 2021.
Patient-matched control DNA is often lacking in clinical settings
and systematic quantitative analyses are required for a detailed
genomic characterization of a patient’s tumor, including presence of
pathogenic germline variants and evidence for loss of heterozygosity (LOH).
Genomics Oncology Platform is a Python-based GUI for the extraction of relevant information and
the application of All-FIT and LOHGIC directly on tumor-only sequencing results. This user-friendly, interactive
application can infer germline-versus-somatic status of variants in
individual tumors by analyzing commonly
available sequencing data from commercial or academic assays.
LOHGIC infers mutational status using AIC weights
(W). Khiabanian et al. 2018.
LOH-Germline Inference Calculator (LOHGIC) infers mutational
status of variants identified in deep-sequencing assays. It predicts
loss of heterozygosity (LOH) and provides additional information on the
number of mutated alleles in tumor cells based on specimen’s purity
and a variant’s allele frequency, sequencing depth, and
ploidy.
MERIT quantifies ultra-deep sequencing
error. Hadigol and Khiabanian 2018.
Mutation Error Rare Identification Toolkit (MERIT) is
a comprehensive pipeline designed for in-depth quantification of
erroneous substitutions and small indels in high-throughput
sequencing data, specifically, for ultra-deep applications.
MERIT considers the genomic context of the errors, including the
nucleotides immediately at their 5’ and 3’, and establishes error
rates at 96 possible substitutions as well as four single-base and
16 double-base indels.
Singh & Khiabanian. 2023.
Piccolo is a novel framework for analyzing single-cell data in which feature selection is performed prior to normalization using a residuals-based approach.
Piccolo's feature selection identifies both stable and highly variable genes (HVG). Using the stable genes, Piccolo estimates cell-specific size factors for performing normalization on the counts matrix for HVG, ensuring effective variance stabilization, and significantly improving dimensionality reduction and other downstream analyses.
Subtype enrichment of TuBA's biclusters
in the METABRIC cohort of 1,970 breast tumors.
Biclusters of proximally
located genes with copy number gains,
color-coded according to their chromosomes (left),
and the rest arranged according to their serial numbers (right). Singh et al. 2019.
Tunable Biclustering Algorithm (TuBA) is a novel graph-based unsupervised biclustering algorithm,
customized to identify alterations in tumors based on the hypothesis
that gene pairs relevant to a clinical process share a statistically
significant number of samples with extreme expression.
TuBA identifies samples in pre-determined upper or lower
percentile sets whose pairwise comparison
identifies gene pairs that share a
statistically significant number of samples. Each significant gene
pair is illustrated graphically as pairs of nodes connected by an
edge that represents the shared samples in their percentile sets.